Peculiarities of bunch shape measurements of h-minus
beams in linear accelerators
|
||
|
A.Denisov, A.Feschenko,
Institute for Nuclear Research, A.Aleksandrov, ORNL, |
||
|
Abstract When measuring a bunch shape of
H-minus beam with the bunch shape monitor (BSM) based on a transverse
scanning of low energy secondary electrons the difficulties due to presence
of detached electrons arise. Fraction of the detached electrons gets into the
optical channel of BSM and produce additional signals thus distorting
measurement data. The results of simulation of interaction of the electrons
with the BSM target and analysis of their subsequent motion in BSM electron
optical channel are presented. Distortions of the measurement results are
discussed. It is demonstrated both by simulations and experimentally that
energy separation of the electrons essentially decreases the distortions.
Other possible reasons of errors are also discussed. |
||
Introduction
Principle of operation of BSM has been reported
elsewhere [1]. Initially BSM was developed for proton beam of INR linac [2]. Later it was used in several accelerators,
including machines with H- beams, without modifying its
configuration. For several MeV beams no features
connected with H- were observed [3, 4]. For tens MeV
[5] experimental curves included additional hump identified to be due to
detached electrons originated in a tungsten BSM wire target. Analysis of the total electron-loss cross section in
the energy range of interest (10÷1000 MeV)
[6] as well as the ranges of electrons in a tungsten [7] has shown that
electrons are detached in a thin near surface layer much smaller than both target diameter and CSDA ranges
of electrons. In this case a flux of free electrons impinging the target can
be analyzed instead of electrons detached from H-. The energy of
electrons We and that of
H- Wi
are related as |
||
Simulation
of interaction of electrons with BSM target
|
||
|
The simulation of interaction of electrons with BSM
target was done with a toolkit
for the simulation of the passage of particles through matter Geant4 [8]. Number of impinging electrons was 105 for each coordinate X across the 100 μm diameter target taken with a step of 1 μm. The result of simulation is an array of
parameters of electrons escaped the target. Some of the simulation results
are given in figures 1÷ 3.
|
||
|
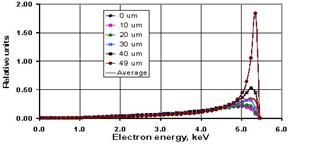
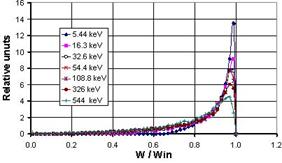
Figure
1: Energy distribution of 5.44 keV electrons after interaction with the target for different input coordinates X. |
||
|
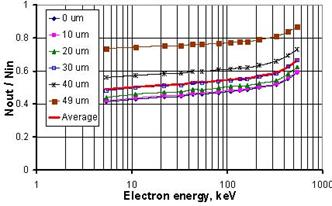
Figure 2: Fraction of electrons escaped the target
for different input coordinates X. |
||
|
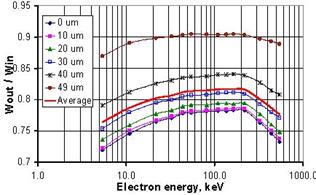
Figure
3: Average energy of escaped electrons normalized by input energy vs input energy Win. |
||
Simulation
of electron motion in bsm optical channel.
|
||
|
Parameters
of electrons escaped the target were further used as initial data for
simulation of electron motion in BSM optical channel. These simulations were
done with a specialized software package developed for BSM analysis. The geometry and electrical parameters
of the detector for simulations were taken to be identical to that described
in [9] because of availability of experimental results on influence of the
detached electrons [5] for this BSM. Initial beam was considered to be
uniformly distributed across the wire and normally distributed along the wire
with a |
||
|
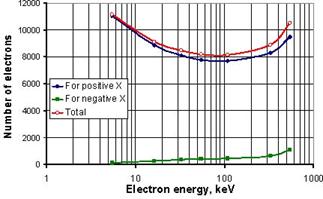
Figure 4: Number of electrons passed through input collimator. |
||
|
Figure 4
demonstrates number electrons passed through |
||
|
Figure 5: Energy distribution of electrons in BSM
optical channel. |
||
|
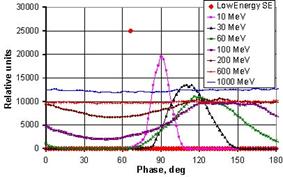
A
detector response function representing an observable longitudinal
distribution in case of a δ-function real distribution is of
special interest. These functions
calculated for different initial electron energies are given in fig. 6 (the
legend shows corresponding H-
beam energies). As a phase resolution for low energy secondary electrons (SE)
is typically better than 1º the corresponding response function
for these electrons is shown as a single point. The detached electrons result
in a background in a measurable function, its shape being gradually
transformed with beam energy from bell-type to uniform in phase. The
transformation becomes smoother when increasing amplitude of rf deflecting field. One should note that the background
is proportional to an integral of the response function. In spite of
relatively small dependence of the detached electron current on energy (fig.
4) the integral of response function increases essentially due to decreasing
of electron beam rf deflection and focusing
degradation. |
||
|
Figure
6: BSM response
function for different ion energies |
||
|
Knowing
a response function one can predict an experimental curve behavior.
Generally, a measured distribution Φ(φ)
and a true one F(φ) are connected as
where К(φ,ψ) is a kernel of integral transformation. The
function К(φ,ψ0)
represents an instrument response function to a δ-function δ(φ-ψ0). In our particular case the measurements with
low energy SE are carried out with a resolution much better that with the
detached electrons so the function thus measured can be considered as a true
one. In this case instead of (1) one can write
and the curves presented in fig. 6 can be
used as functions К(φ,ψ0). The
parameter α is inserted due to uncertainty of low energy
SE and detached electrons intensities and can be found by comparing
experimental distribution and a calculated with (2) function. |
||
|
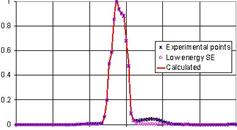
Figure 7: Experimental and calculated with (2) longitudinal distributions
for 10 MeV beam. |
||
|
Figure 7 shows the experimentally observed longitudinal distribution
for 10 MeV beam [5], the component due to low
energy SE F(φ) and the curve Φ(φ) calculated with
(2). The parameter α was selected to fit maximum of the calculated Φ(φ) with
experimental point. The ratio of signal integral to noise integral in this
case is equal to 15. |
||
|
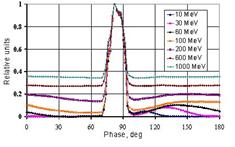
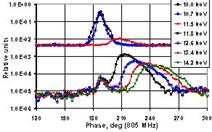
Figure 8: Prediction of experimental curves behavior
for different energies (normalization by maximum value) |
||
|
Low energy secondary electrons originate from
ions, protons and detached electrons. Number of these electrons depends on
particle ionization loss |
||
Using
electron energy separation
|
||
|
Energy difference of the useful low energy secondary
electrons and the detached electrons enables to decrease influence of the
latter using energy separation. The separation is done in a 90º magnetic
spectrometer downstream of the BSM output collimator. This method was
foreseen in BSMs developed for SSC linac [10] but at that time the detectors were not tested
with a beam. It was first implemented and successfully tested in BSMs developed for SNS [11, 12]. With the radius of One can also see that the variation of a set
point does not result in full disappearing of signals within the phase range
corresponding to true bunch. This
effect can be explained by ionization of residual gas in a vacuum chamber of
separating magnet. Positive ions can rich the exit of separating magnet and
can be detected by secondary electron multiplier used as an electron
detector. The distortion of
signal is of the order of 10-3. Also taking into account that the
effect is originated from low energy SE already
separated in phase one can contend that the shape of the true distribution is
not distorted. |
||
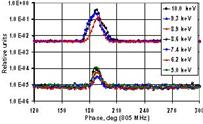
|
|
|
|
|
Figure 11: Measurements for different set points of separating magnet. |
||
|
At the same time residual gas ionization by the
detached electrons is also possible. This ionization gives rise to additional
background disturbing results of precise measurements, for example
longitudinal halo measurements. To diminish the effect an extra pumping of
vacuum chamber of the magnet or/and using a potential barrier for ions in
front of electron collector
can be recommended. |
||
Summary
•
The detached electrons
distort the results of bunch shape measurements essentially. •
However these distortions
are efficiently removed using energy separation of the electrons. •
Modification of BSM is
desirable with the aim to remove residual gas ionization influence. |
||
References
[1] A.Feschenko. PAC2001, [2] A.V.Feschenko, P.N.Ostroumov. Proc. of the 1986 Linear Acc. Conf., Stanford, 1986, p.323. [3] J.W.Hurd et al. Proc. of the 1993 PAC, Washington, 1993, p. 2426. [4] A.V.Feschenko
et al. Proc. of the XIX Int. Linear Acc. Conf., [5] A. Mirzojan et al. Voprosy
Atomnoi Nauki i Tekhniki. V. 4,5 (31,32), [6] George H. Gillespie. Phys. Rev., A, V16, No.3, 1977, p.943. [7] http://physics.nist.gov/PhysRefData/Star/Text/. [8] http://geant4.web.cern.ch/geant4/. [9] A.V.Feschenko et al. Proc of the 1997 Particle Accelerator Conference, Vancouver, 1997, p.2078. [10] S.K.Esin et al. Proc. of
XIV Part. Acc. [11] A. Feschenko et al. Proc of
Linac 2004, [12] A. Feschenko et al. Proceedings of PAC07, Albuquerque, 2007, p. 2608. |
||